

| 1) Run VS.NET Click on "Start->Programs->VS.NET->VS.NET". | |
| 2) Create a new ASP.NET WebSite Click the menu "File->New->Project" In the "New Project" Dialog select the language of your choice. For now lets just select "Visual C# Projects" in the Project Types treeview and select "ASP.NET Web Application" in the Templates list. Specify a name for it. The dialog should look like the following image. Click OK. 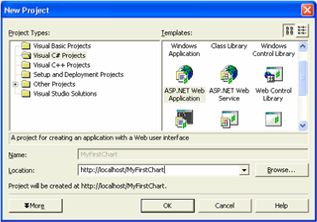 | |
| 3) Add the WebChart control to the toolbox NOTE : Before moving ahead, you will need to download WebChart.dll. Download This is an optional step, but it makes life easier if you plan on using the control on more than one project, since it will no longer require you to add references, nor copy the control, etc. While in the WebForms Designer. Select the option menu "View->Toolbox". Right click on it and select the option Customize Toolbox. Once in the "Customize Toolbox" Dialog, select the “.NET Framework Components” Tab. Click the Browse button. 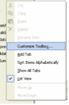 And look for the file WebChart.dll. Click Ok. The dialog should look as follows. Click Ok. 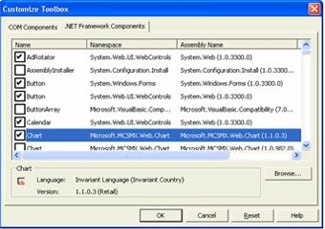 | |
4) Add a Chart to the WebForm To Add a Chart to the WebForm, you can just Drag a Chart control (added in the previous step to the toolbox, look for the small chart glyph) 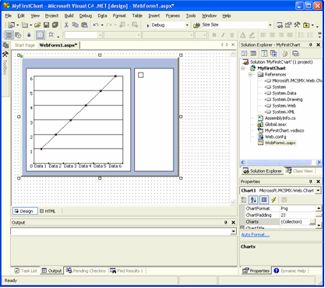 | |
| 5) Add some formatting to the chart You can add easily formatting to your chart by right clicking on it and selecting the option “Auto format…” or from the Property Grid.  | |
| 6) Add a Chart to the control You can add the charts either from code or from design time. It is easier to do in design time, since doing this way, you can actually get a WYSIWYG version of the control without even having to run it. To add a chart in Design Time, just double click the Charts… Property in the Property Window. 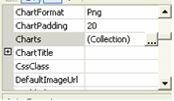 This will launch the Chart Editor, where you can add any type of Chart (LineChart, ColumnChart, etc) by choosing the drop down button at the bottom of the dialog and configure all their properties. So for now, Add a LineChart and assign it a Name of “MyChart”, and click Ok. 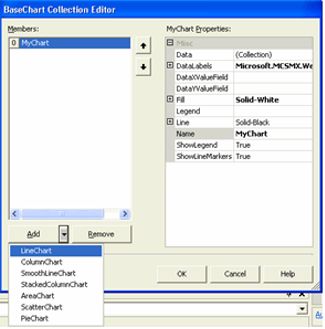 | |
| 7) Add code to add points and render the chart Double click on the Designer to take you to the Page_Load event of your page. Add a using statement at the top of the page code to avoid writing the namespace in all your declarations. All points in the Chart are represented with the ChartPointclass. So in the code below we first grab a reference to the Chart already in the control (since it was added in design time), and then use its Data property to add the Points. Note that you need to cast the chart to the correct type of chart, since it returns a Chart class that is the base class for all charts. At the end we call RedrawChart method that creates the file. THIS IS REALLY IMPORTANT, every time you want the control to redraw the chart, you need to explicitly call this method, if you fail to do so, it will not create the image file. | |
| 8) Compile and Run the page. | |
Hope this post will help you,
if yes please put comment below of this page,
Rajesh Singh,
Asp.Net Developer
Indianic Infotech Ltd (India)
rajesh@indianic.com


No comments :
Post a Comment